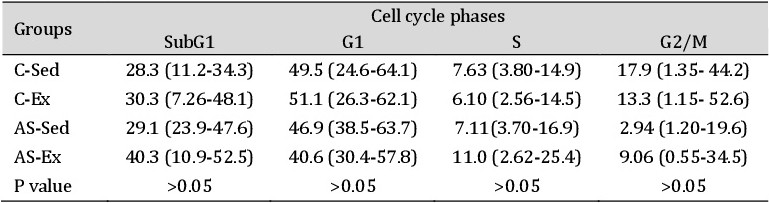
Table 5. Analysis of DNA content and distribution in the phases of the cell cycle (%). Sub G1, apoptotic; G1, cell growth; S, DNA synthesis; G2/M, mitosis. C-Sed, sedentary control group (n=8); C-Ex, exercised control group (n=6); AS-Sed, sedentary aortic stenosis group (n=9); AS-Ex, exercised aortic stenosis group (n=6). Data are median and percentiles; Kruskal‐Wallis and Dunn. p<0,05